Cyber Monday 2012 Wrap up
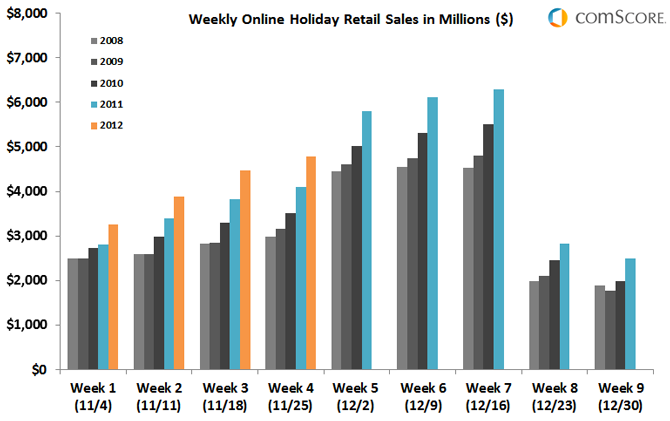
by Anvil on November 30, 2012b2cWow, what a busy Cyber Monday we had this year. There’s proof popping up everywhere that this was the biggest Cyber Monday yet! According to comscore, internet sales in the US alone reached $1.46 billion on Monday which is an increase of 17% from last year’s data. As seen in this chart below, year-over-year more consumers are completing their holiday shopping online.

What Industries Came Out On Top?
Did one specific sector see a huge increase or was it across the board? Let’s take a look at some industry breakdown, shall we?

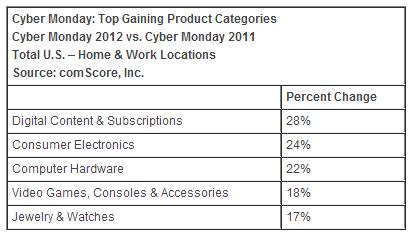
From comscore:
Cyber Monday saw Digital Content & Subscriptions continue to set the pace among product categories with a year-over-year growth rate of 28 percent. Consumer Electronics, buoyed by gains in smartphone sales, ranked second at 24 percent, while tablet sales helped the Computer Hardware category post a 22-percent growth rate. Video Games, Consoles & Accessories (up 18 percent) and Jewelry & Watches (up 17 percent) rounded out the top five.
Where Were People Conducting Their Online Shopping?
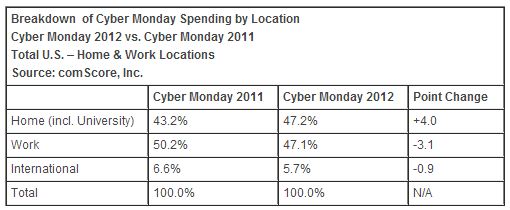
Another interesting data point is where internet shoppers are doing their shopping. Should businesses just close this day and consider it a holiday?

We can see that while shopping from work still accounts for 47% of the Cyber Monday transactions, this is a 3% decrease from 2011.
Were The Deals That Great?
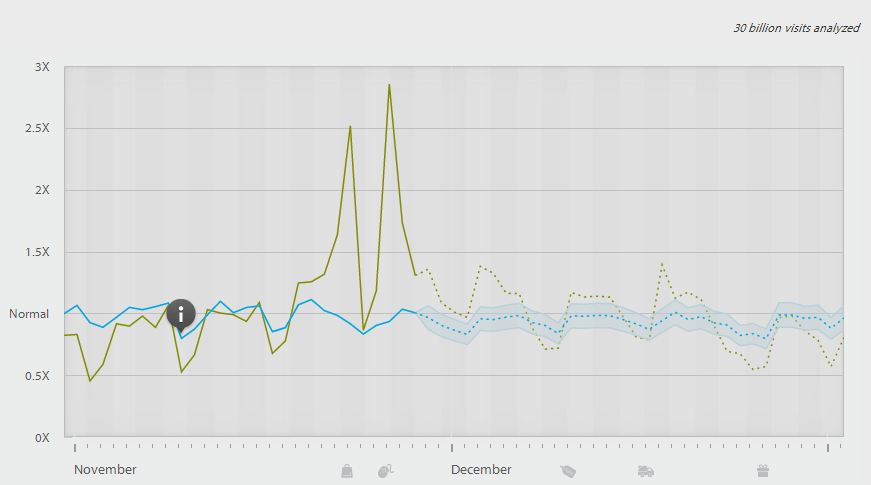
Adobe Digital Index is a similar service to comscore. In the graph below the green line represents Online US Sales of Electronics from November 2012 through December 2012 (data prediction is represented by dashed line); the blue line represents the average price paid for Electronics online in the US.

The first spike is Black Friday and the second spike is Cyber Monday. Notice how the lowest average price for electronics was actually reported in early November well before all the special savings were in effect. Adobe Digital Index allows you to segment this data based on a number of other factors and I recommend checking it out.
